
Polar Opposites
By: John Vereen
We
will be exploring graphs in polar coordinates of the form ![]() where a, b, and k are integers. First
let’s explain the significance of the variables r and
where a, b, and k are integers. First
let’s explain the significance of the variables r and ![]() . The variable r stands for radius,
and each circle going outward in the graph above represents an increase of r by
1. The variable
. The variable r stands for radius,
and each circle going outward in the graph above represents an increase of r by
1. The variable ![]() represents the angle that is subtended by
r at a specific time. Theta is measured by the lines going outward from the
origin from [0,2pi].
represents the angle that is subtended by
r at a specific time. Theta is measured by the lines going outward from the
origin from [0,2pi].
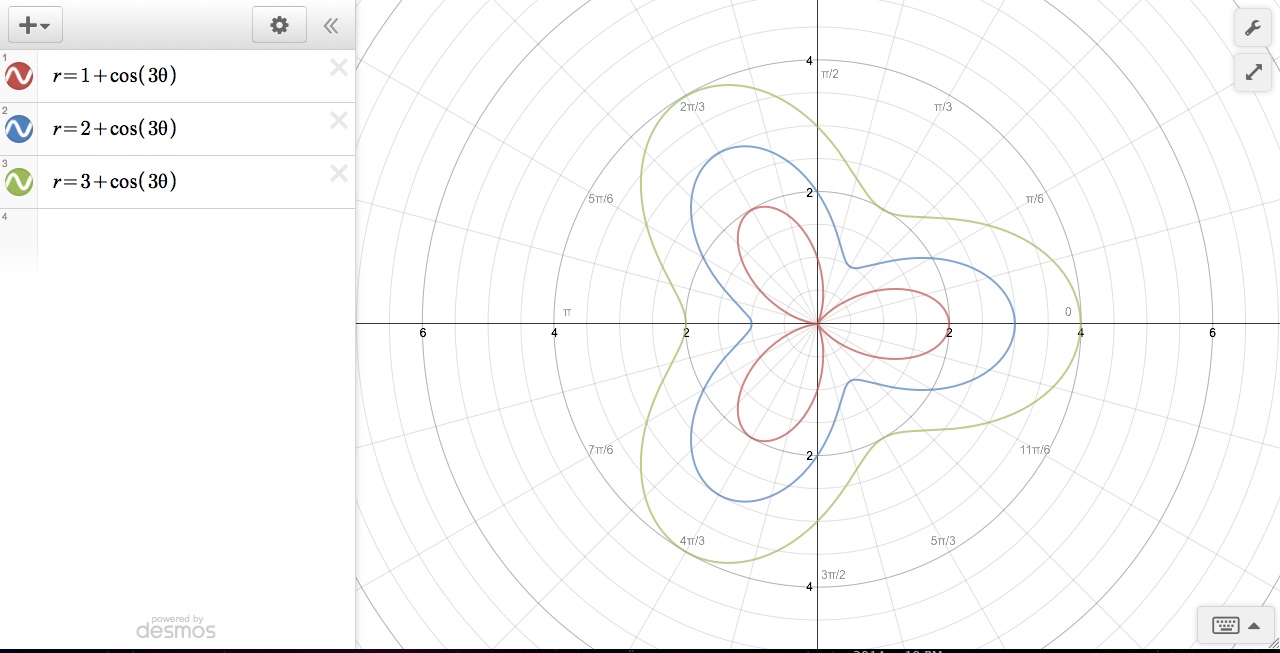
Now
let’s explore how variances in a affect the
graph. As we can see above, the petals of the graph seem to become less defined
as a
increases in magnitude. Why is this? We see that a represents a shift, just as it does in the Cartesian plane. The constant a shifts the
variable r. Since the cosine function represents values on the unit
circle, it will only cover r values that are, at most, to radii apart. So, with
the first graph ![]() , , we see a shift of r by 1. So,
instead of sweeping the standard [-1,1], r will cover values [0,2]. We start
seeing a pattern when a=2 in the equation
, , we see a shift of r by 1. So,
instead of sweeping the standard [-1,1], r will cover values [0,2]. We start
seeing a pattern when a=2 in the equation ![]() because r covers values [1,3], which
produces less pronounced petals in the graph. Now we see, mathematically, why
the petals are less pronounced; because r is being
shifted outward by the value of a. It
is also interesting to point out that the graphs
because r covers values [1,3], which
produces less pronounced petals in the graph. Now we see, mathematically, why
the petals are less pronounced; because r is being
shifted outward by the value of a. It
is also interesting to point out that the graphs ![]() and
and ![]() map onto each other, so the petals are
less pronounced for negative a as well as positive a.
map onto each other, so the petals are
less pronounced for negative a as well as positive a.
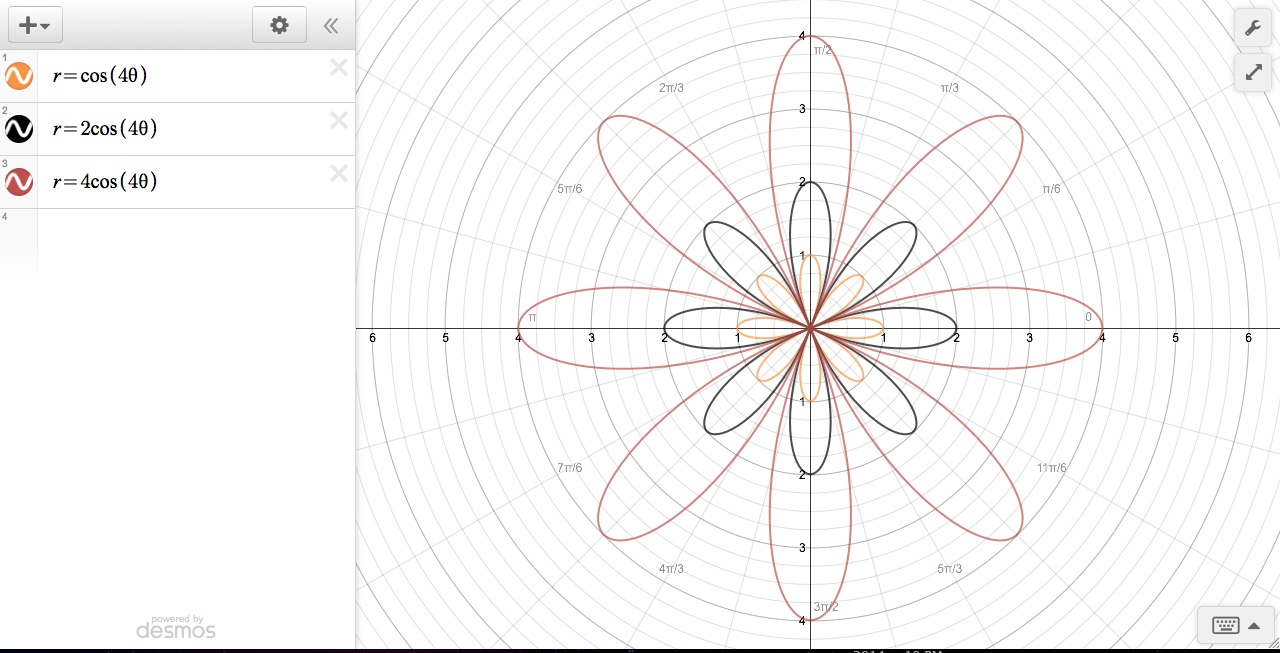
We
will also explore how changes in b
affect graphs of form ![]() . In the graph above, I fixed the
values a=0 and k=4. When we varied b, the overall shape of the graph stayed the
same; however, as b increased, we see changes in the radius length of each
graph. The b value affects the radius
just as the a value does. However,
instead of shifting r additively like the constant a, the constant b shifts
r multiplicatively. This is why the shape of the graph/petals is maintained and
why the constant b is always zero
when the cosine is zero: a+0=a while b(0)=0. Thus, we
can conclude that the value b affects
the amplitude of the graph in the polar plane.
. In the graph above, I fixed the
values a=0 and k=4. When we varied b, the overall shape of the graph stayed the
same; however, as b increased, we see changes in the radius length of each
graph. The b value affects the radius
just as the a value does. However,
instead of shifting r additively like the constant a, the constant b shifts
r multiplicatively. This is why the shape of the graph/petals is maintained and
why the constant b is always zero
when the cosine is zero: a+0=a while b(0)=0. Thus, we
can conclude that the value b affects
the amplitude of the graph in the polar plane.
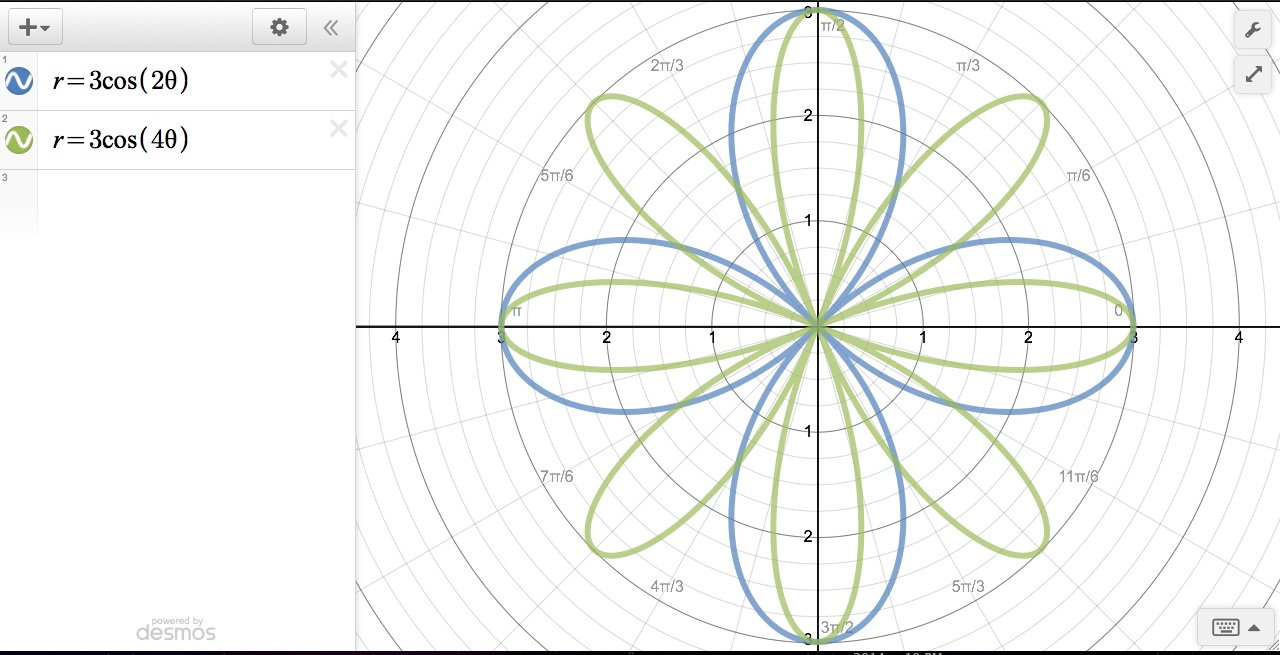
Finally,
we will see how different values of k affect the shape of graphs of ![]() . From the graphs above, we can
conclude that the value of k has a
direct effect on the number of petals that the graph will have. The number of
petals in the polar plane is synonymous to periodicity in the Cartesian plane.
. From the graphs above, we can
conclude that the value of k has a
direct effect on the number of petals that the graph will have. The number of
petals in the polar plane is synonymous to periodicity in the Cartesian plane.
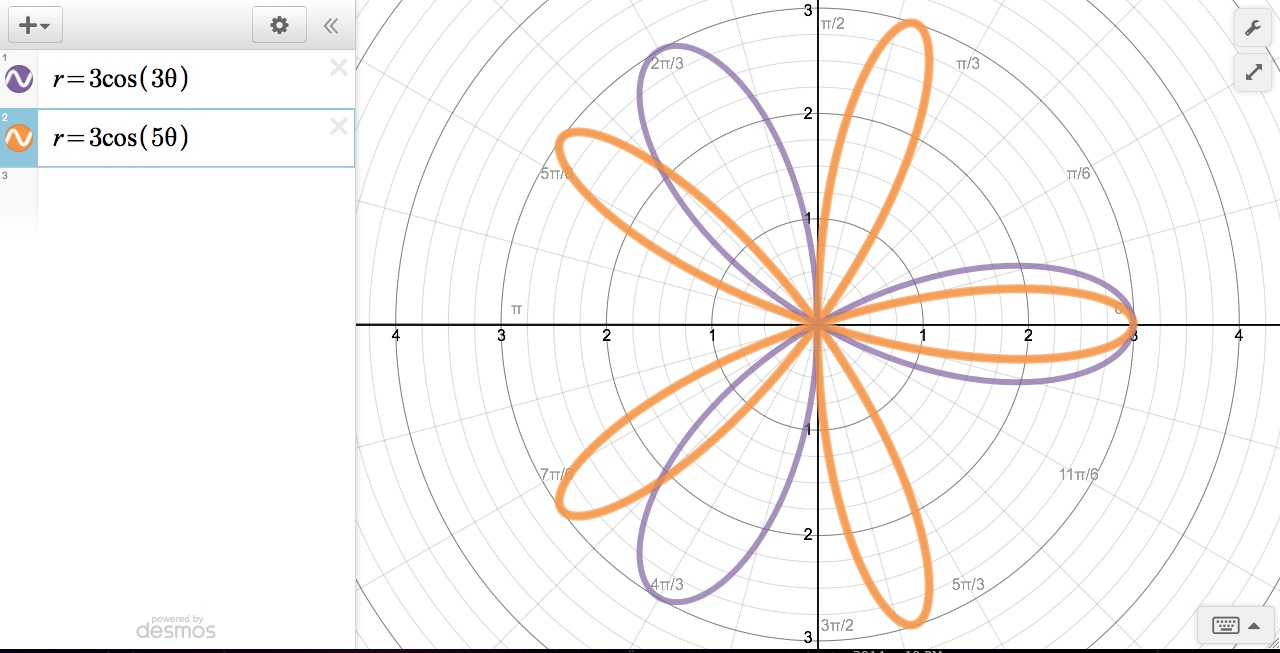
An
interesting fact about k is that it
differs between even and odd numbers. As we can see above, if k is even, then the graph will have a
number of petals equivalent to 2k. If
k is odd, then it appears the graph will have a
number of petals equivalent to k.
This is because every polar graph of form ![]() actually has a number of petals equal to
2k, but with odd numbers the second
half of the petals are mapped onto the first half. So for example, a function
actually has a number of petals equal to
2k, but with odd numbers the second
half of the petals are mapped onto the first half. So for example, a function ![]() actually maps 10 petals, but the second 5
petals are mapped is directly onto the locations of the first 5 petals.
actually maps 10 petals, but the second 5
petals are mapped is directly onto the locations of the first 5 petals.
If
we changed ![]() to
to ![]() , then we would have graphs of the
same shape, just at different locations on the polar axes. A method we can use
for mapping the cosine graph onto the sine graph is inputting a value theta
such that, when multiplied by k,
produces a 90 degree (or pi/2) rotation counterclockwise. This works because,
on a standard unit circle, cosine=1 at 0 and when we rotate by 90 degrees,
sine=1. So in order that the cosine function equals the sine function, we must
have an input
, then we would have graphs of the
same shape, just at different locations on the polar axes. A method we can use
for mapping the cosine graph onto the sine graph is inputting a value theta
such that, when multiplied by k,
produces a 90 degree (or pi/2) rotation counterclockwise. This works because,
on a standard unit circle, cosine=1 at 0 and when we rotate by 90 degrees,
sine=1. So in order that the cosine function equals the sine function, we must
have an input ![]() = 90.
= 90.